About this product
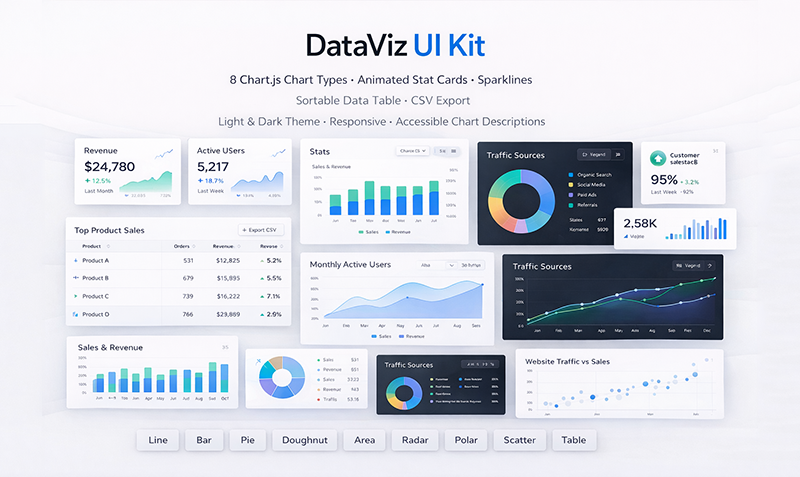
DataViz UI Kit is a complete dashboard and data visualisation component system built on Chart.js. If you're building an admin panel, analytics dashboard, or any data-heavy interface, this kit gives you everything you need in one cohesive package.
Eight Chart.js chart types are pre-configured with sensible defaults, consistent colour palettes, and responsive sizing: line, bar, horizontal bar, doughnut, pie, radar, polar area, and scatter. Each chart ships with two variants — standard and 'filled' — and all tooltips are accessible to keyboard users.
The animated stat card components display a metric, a trend indicator (up/down arrow with percentage), and an inline sparkline in a compact card. On mount they count up from zero to the final value with a configurable easing curve.
The data table component is sortable on any column (client-side for small datasets, server-side hook available for large ones), filterable via a search input, paginated, and includes a CSV export button that generates a properly formatted file from the current filtered and sorted view. Light and dark themes are both included.